Main Street, Clarkston · March 31–April 24, 2026

A dangerous pattern
after dark.

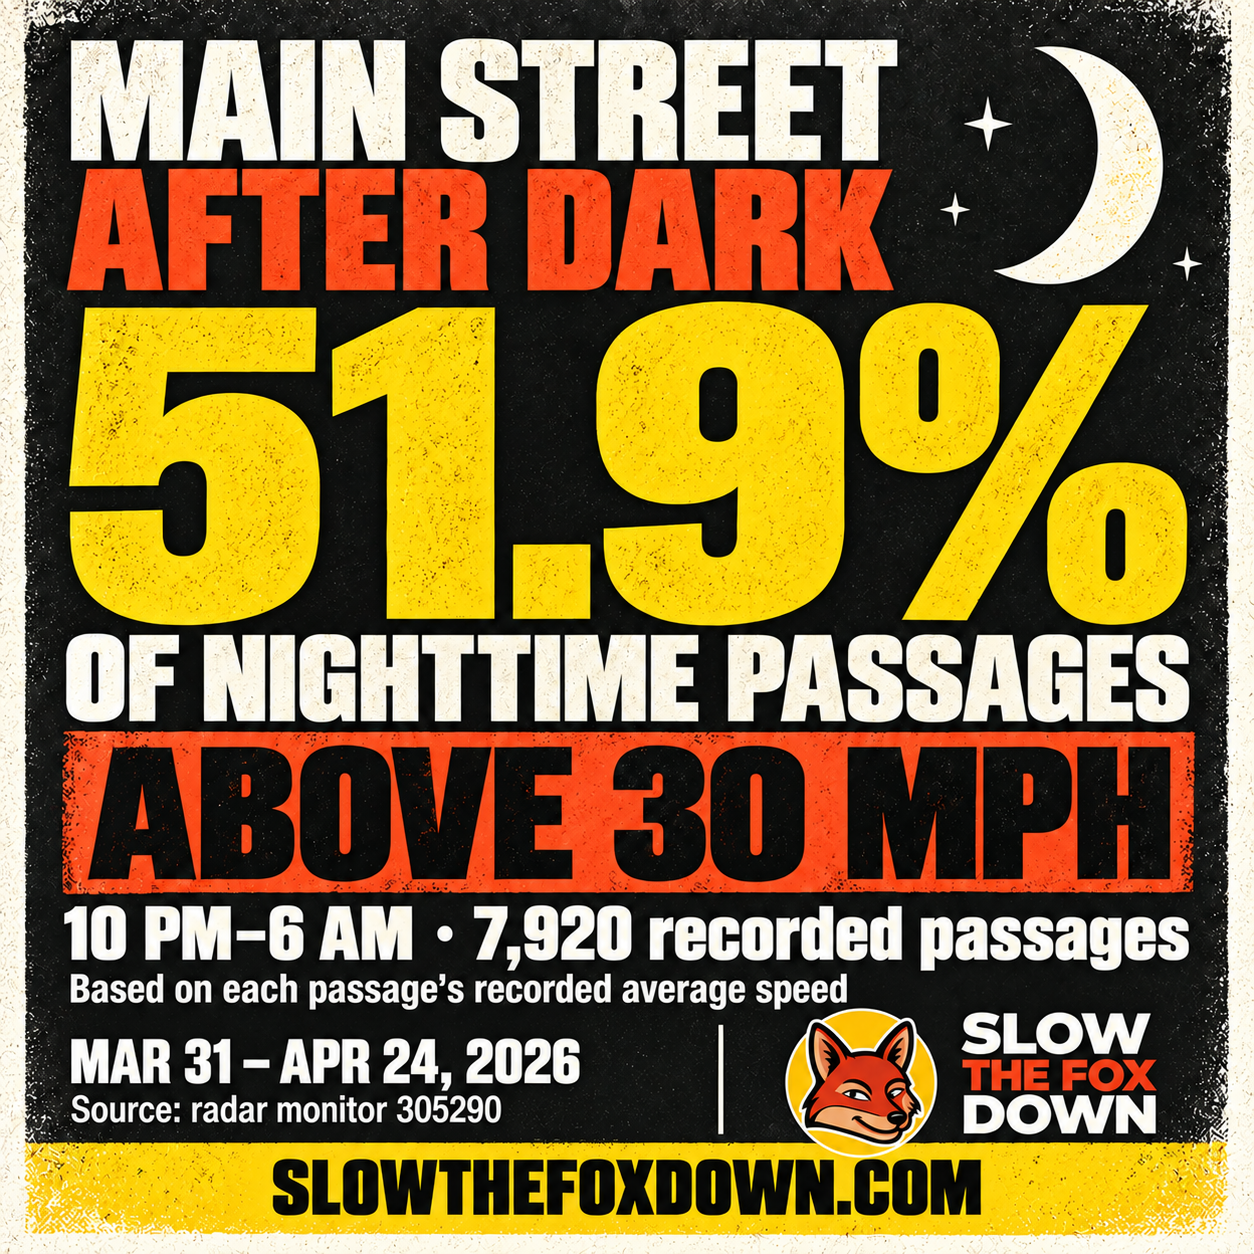
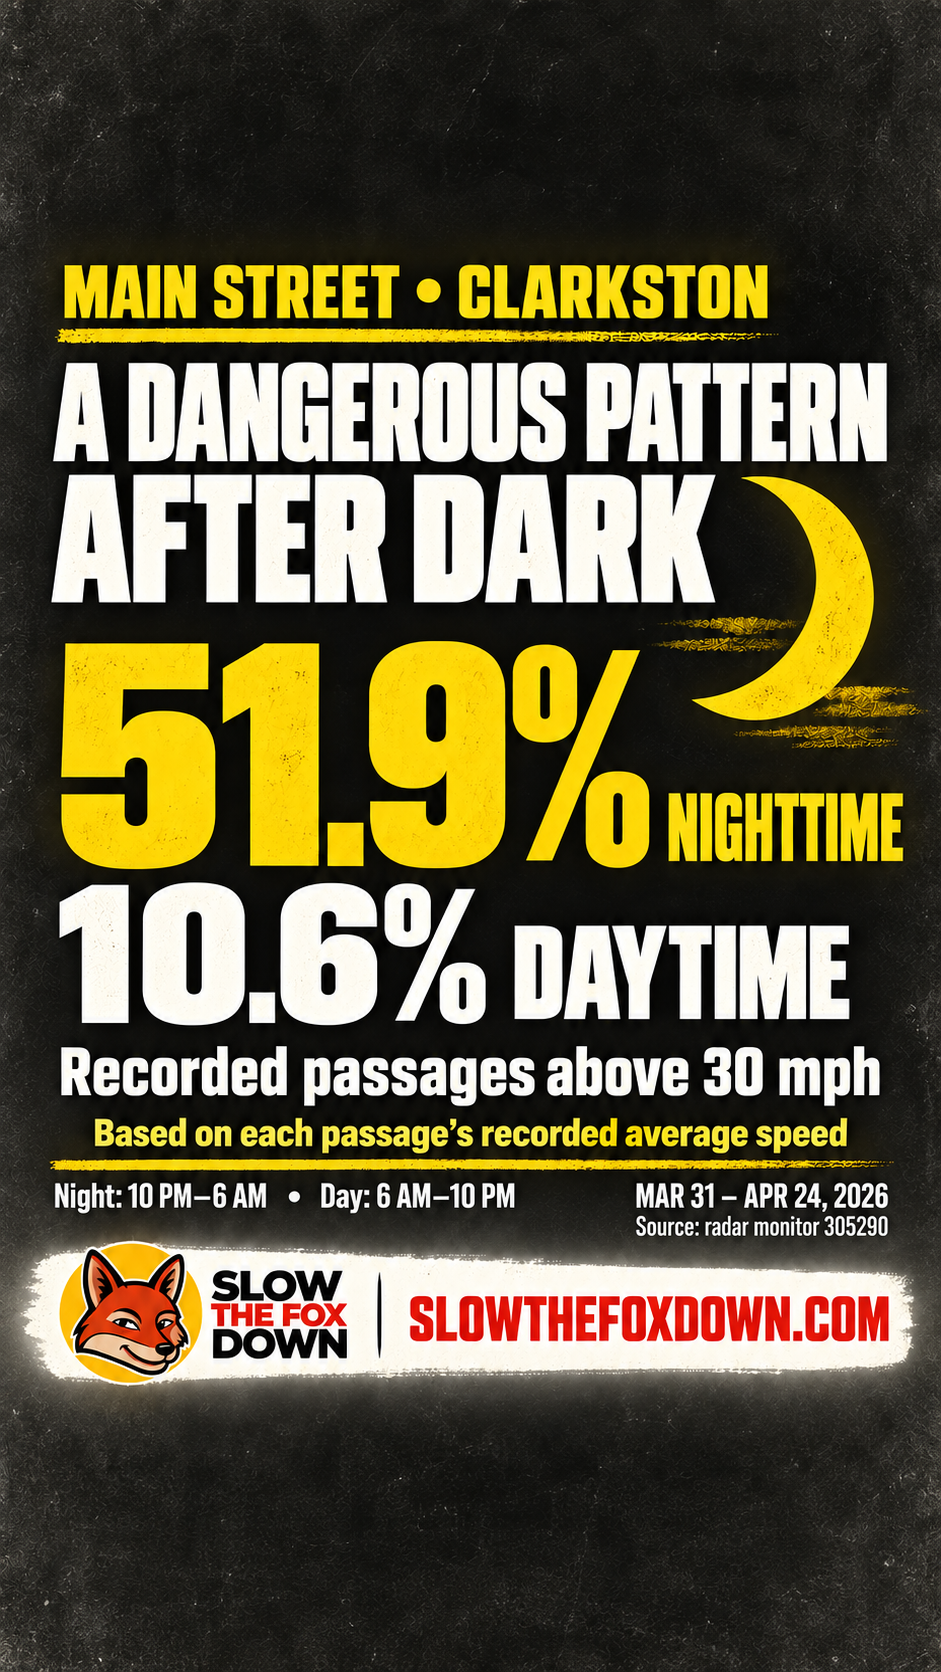
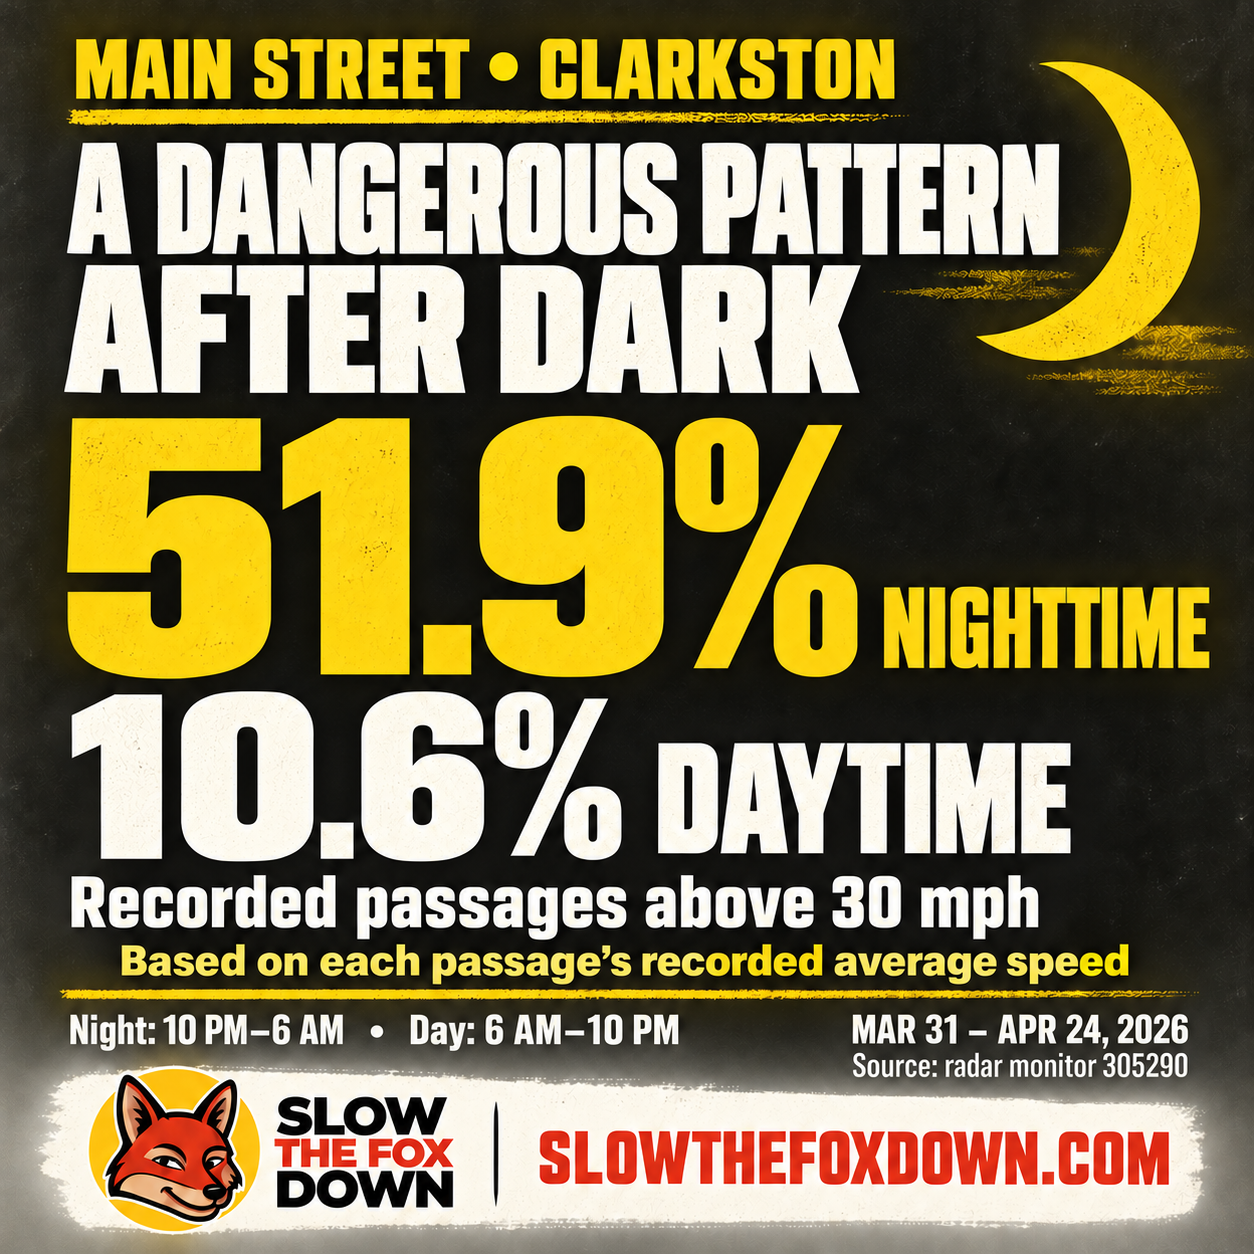
51.9% above 30 mph at night versus 10.6% by day, using recorded average speeds. Nearly five times the daytime above-limit rate. Download a square post or vertical Story, then copy its caption. SlowTheFoxDown.com stays on every image.

Choose a card ↓

30 mph limit · Night: 10 PM–6 AM · Day: 6 AM–10 PM

See the full report.

Daily charts, hourly heatmap, and source data & method.

Recorded peaks. Nighttime speeding. Main Street, Clarkston.

Main Street, Clarkston

Choose a finding.
Share the evidence.

Download an image and copy its caption. The website address stays with every screenshot.

Download all 8 posts + Stories ↓8 square + 5 vertical JPEGs · Captions · Report · Source data
Main Street in Clarkston: 51.9% of nighttime passages above 30 mph, versus 10.6% by day. Night 10 PM–6 AM, day 6 AM–10 PM. March 31–April 24, 2026. Based on each passage’s recorded average speed. March 31–April 24, 2026. SlowTheFoxDown.com.

Nighttime versus daytime

A dangerous pattern after dark.

Download square PNG Download vertical Story
Caption to copy
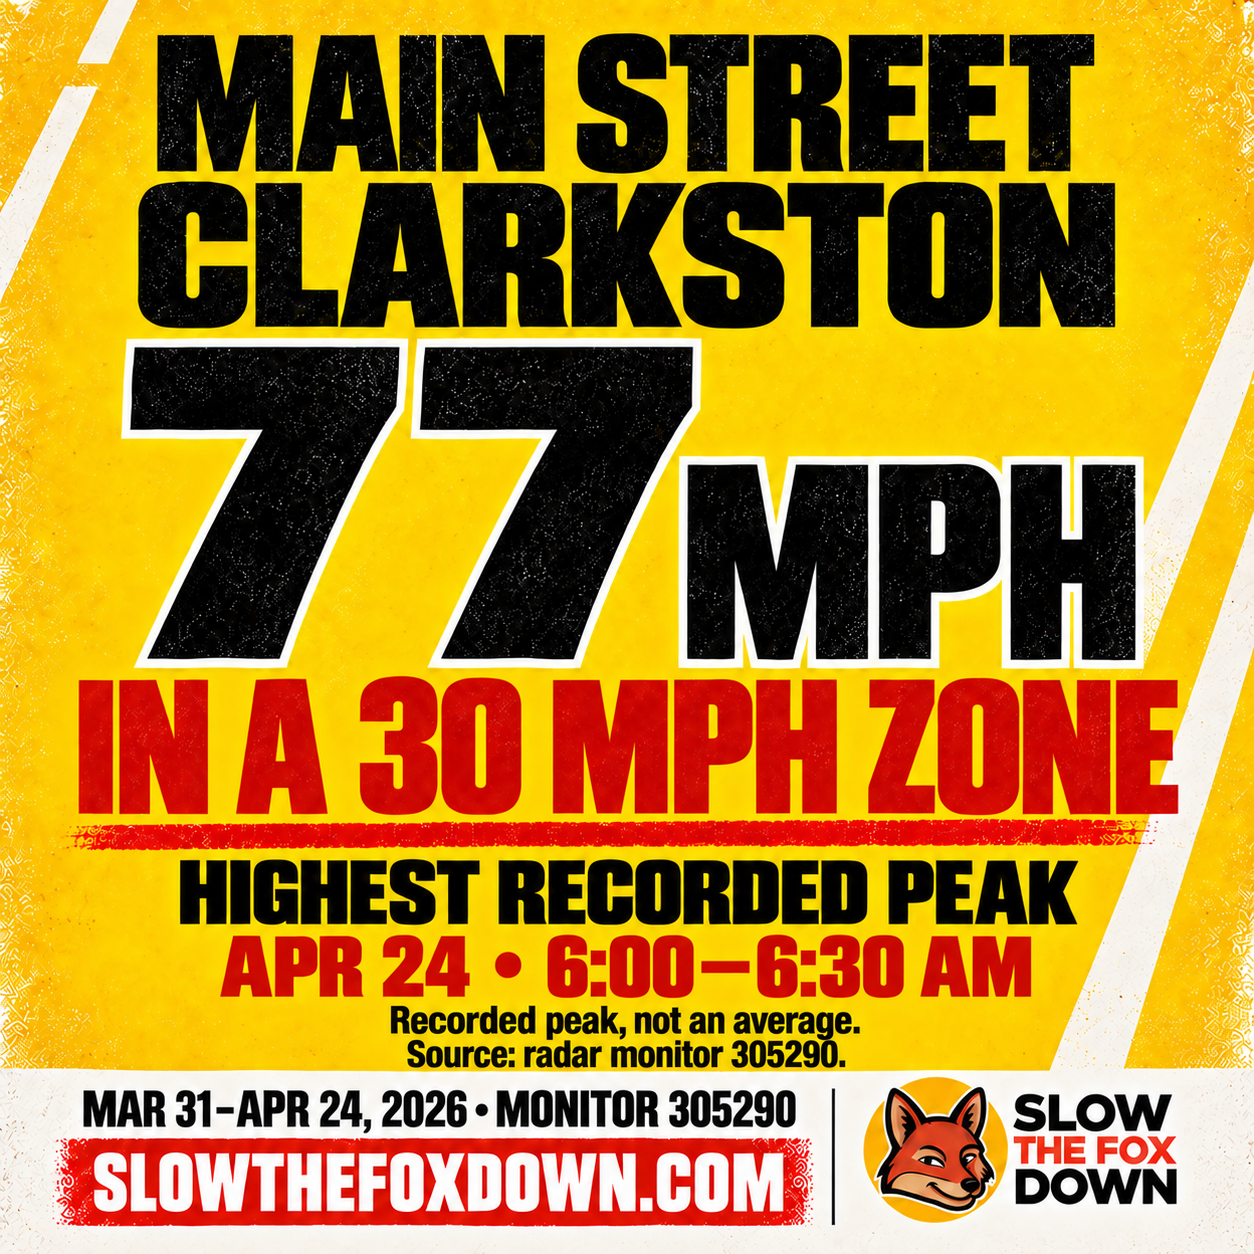
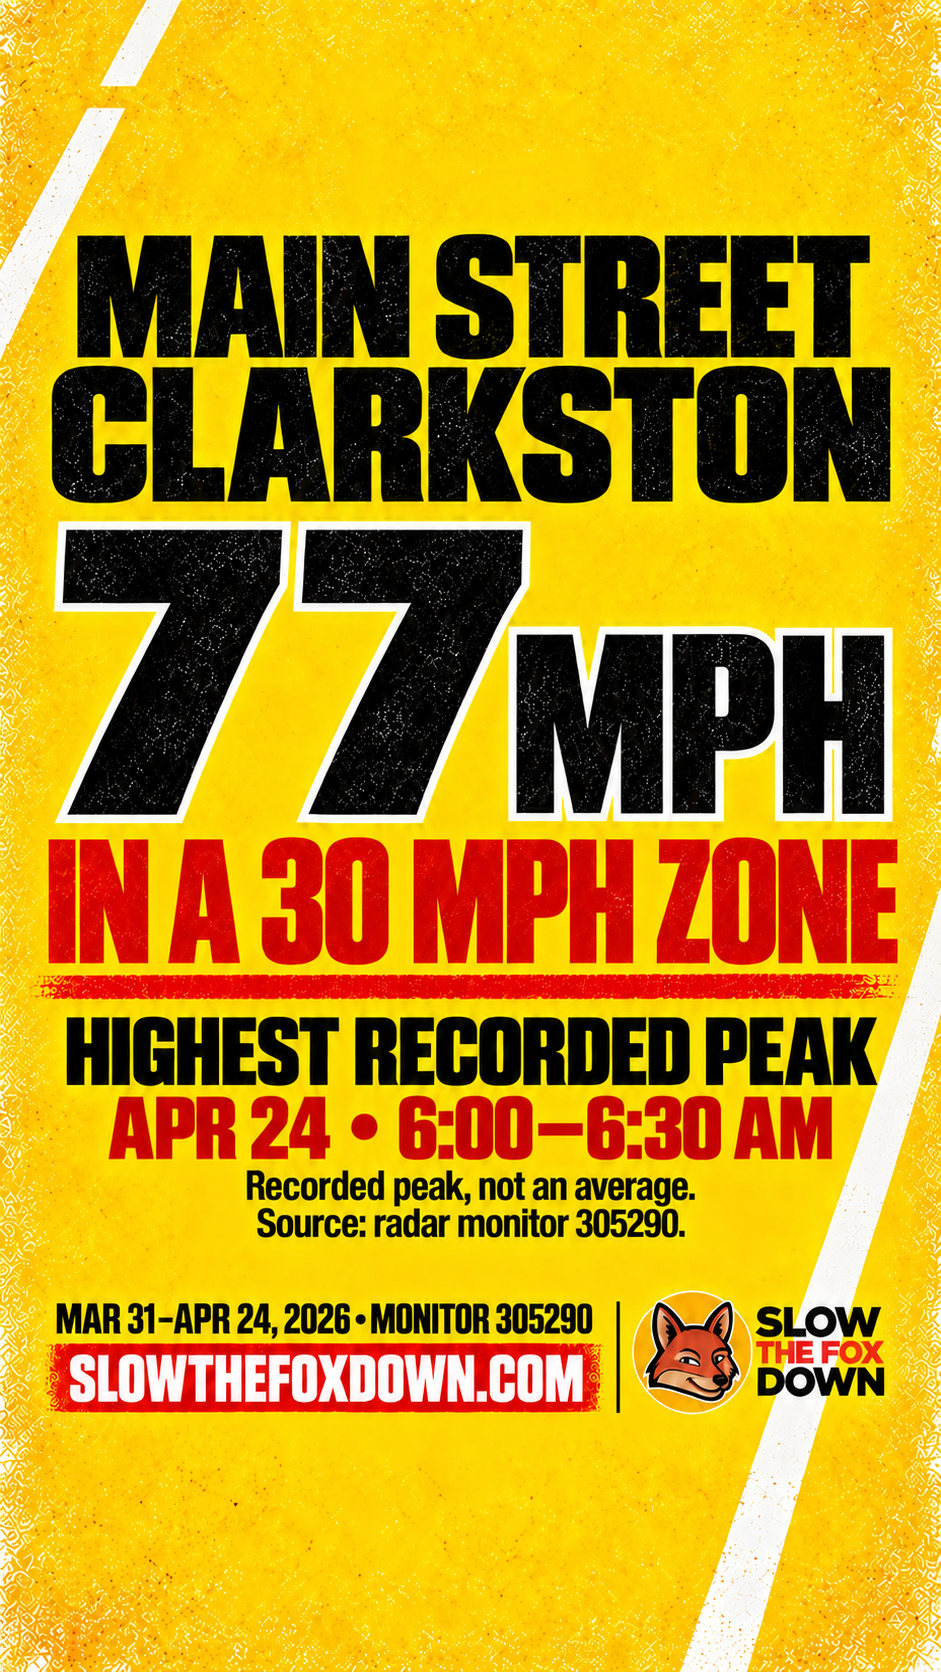
77 mph recorded in a 30 mph zone. Recorded peaks, not averages. Source: radar monitor 305290. March 31–April 24, 2026. SlowTheFoxDown.com.

Highest recorded peak

77 mph recorded in a 30 mph zone.

Download square PNG Download vertical Story
Caption to copy
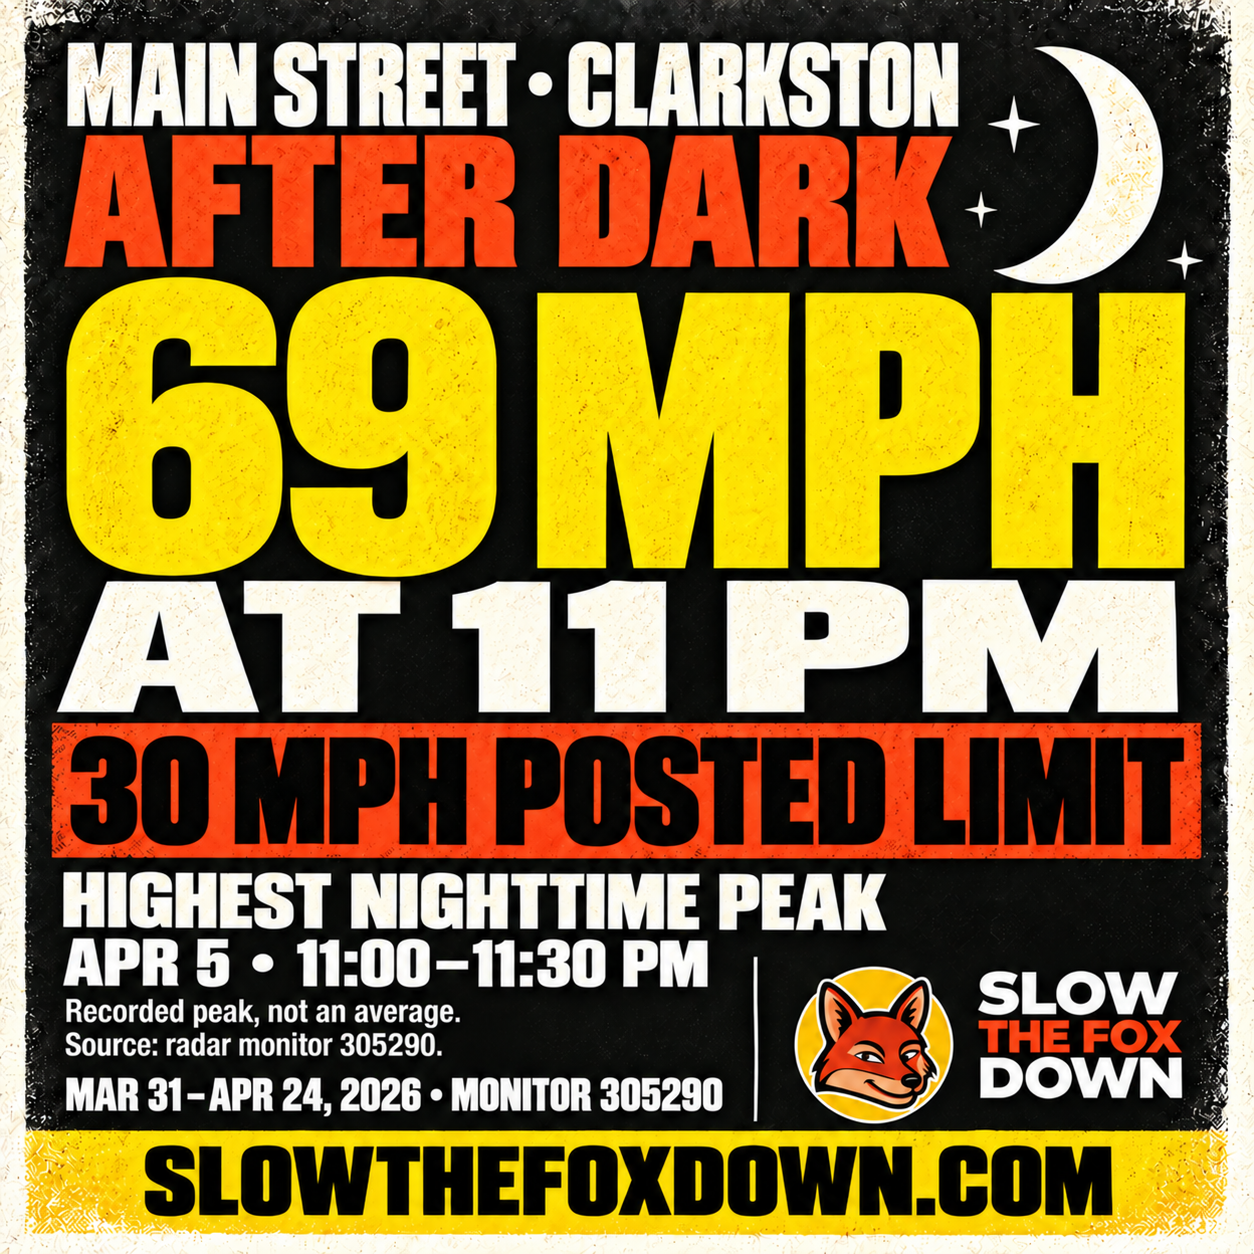
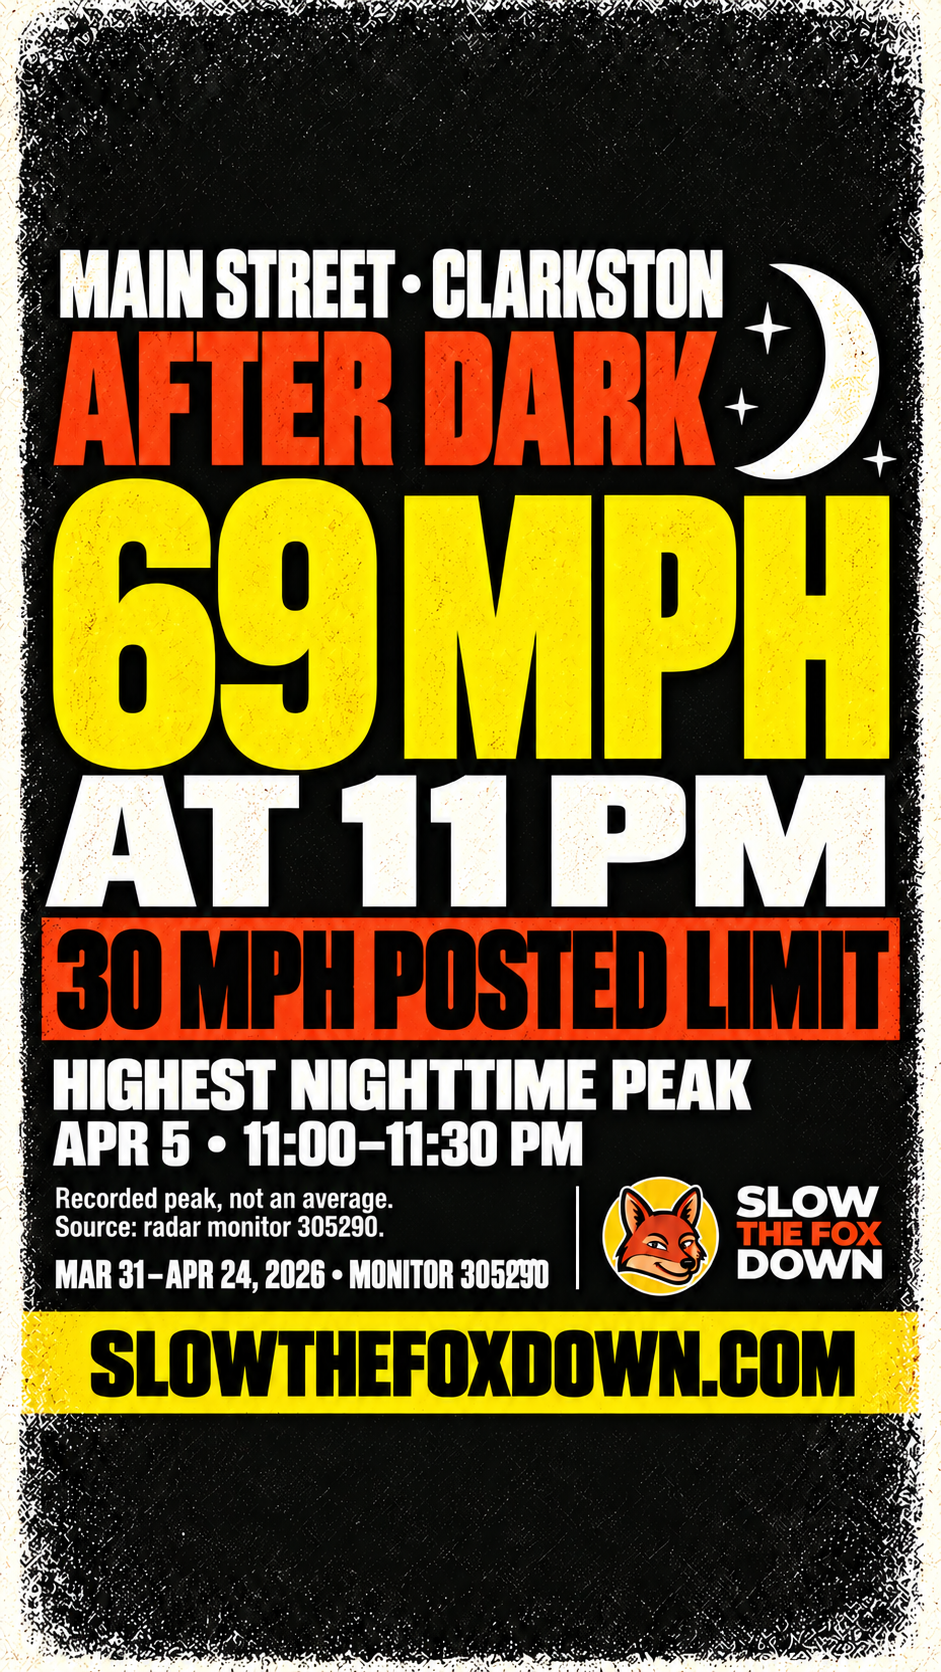
69 mph in the 11 PM half-hour. Recorded peaks, not averages. Source: radar monitor 305290. March 31–April 24, 2026. SlowTheFoxDown.com.

Highest nighttime peak

69 mph in the 11 PM half-hour.

Download square PNG Download vertical Story
Caption to copy
51.9% of nighttime passages averaged above 30 mph, 10 PM–6 AM, 7,920 recorded passages. Based on each passage’s recorded average speed. March 31–April 24, 2026. SlowTheFoxDown.com.

Nighttime speeding

More than half above 30 mph at night.

Download square PNG
Caption to copy
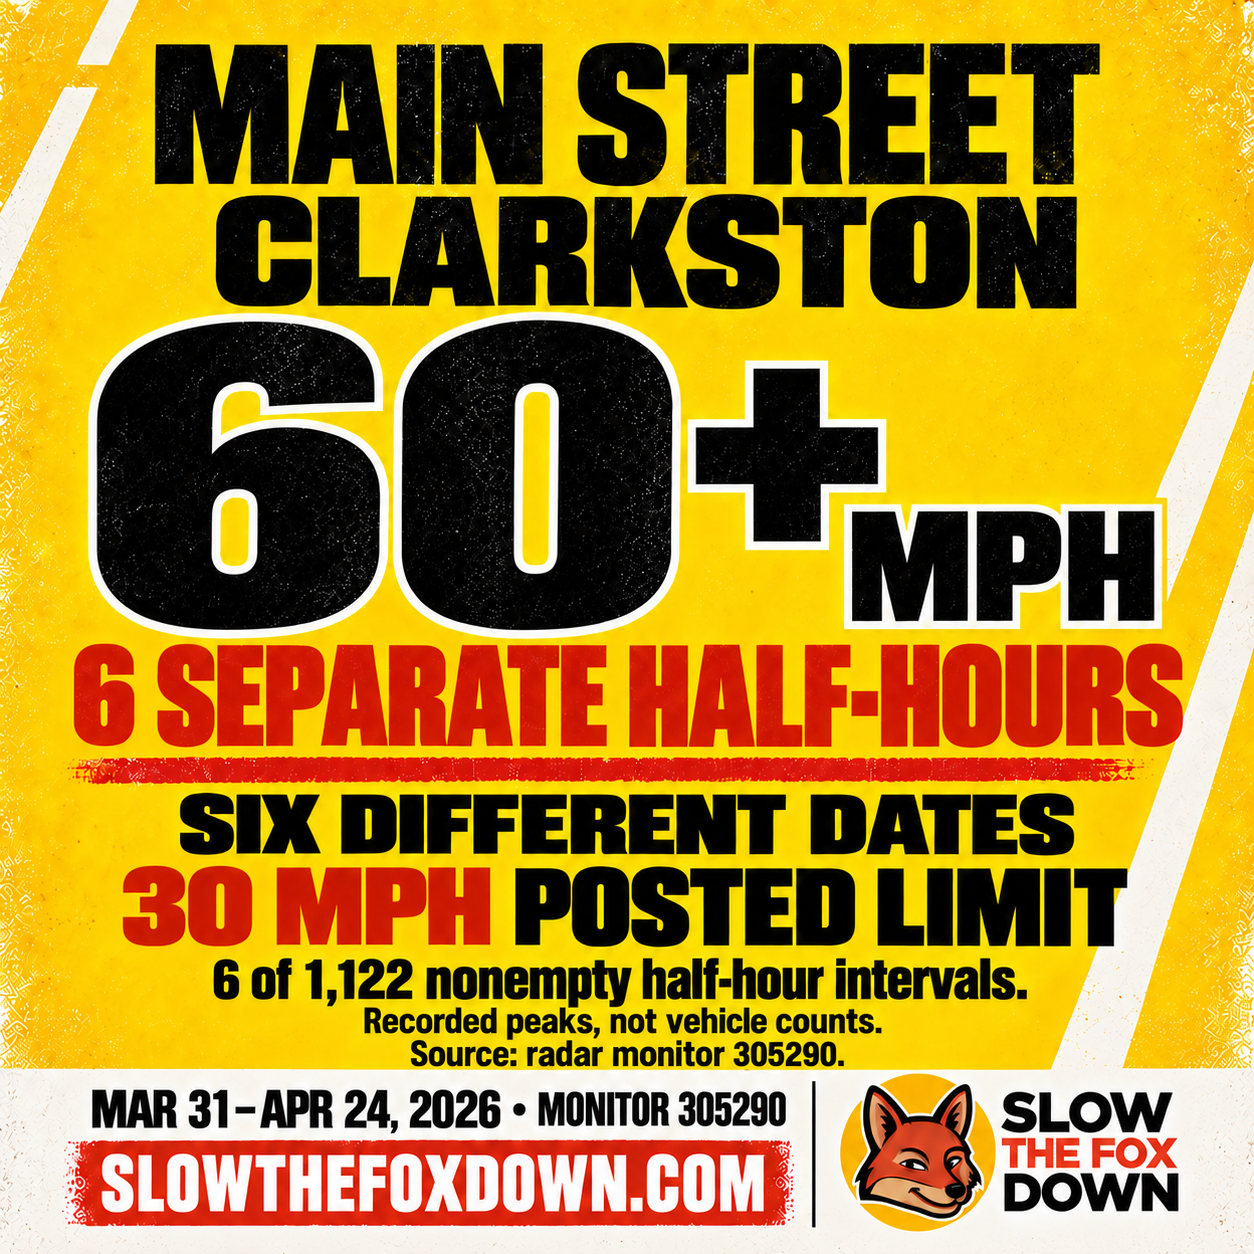
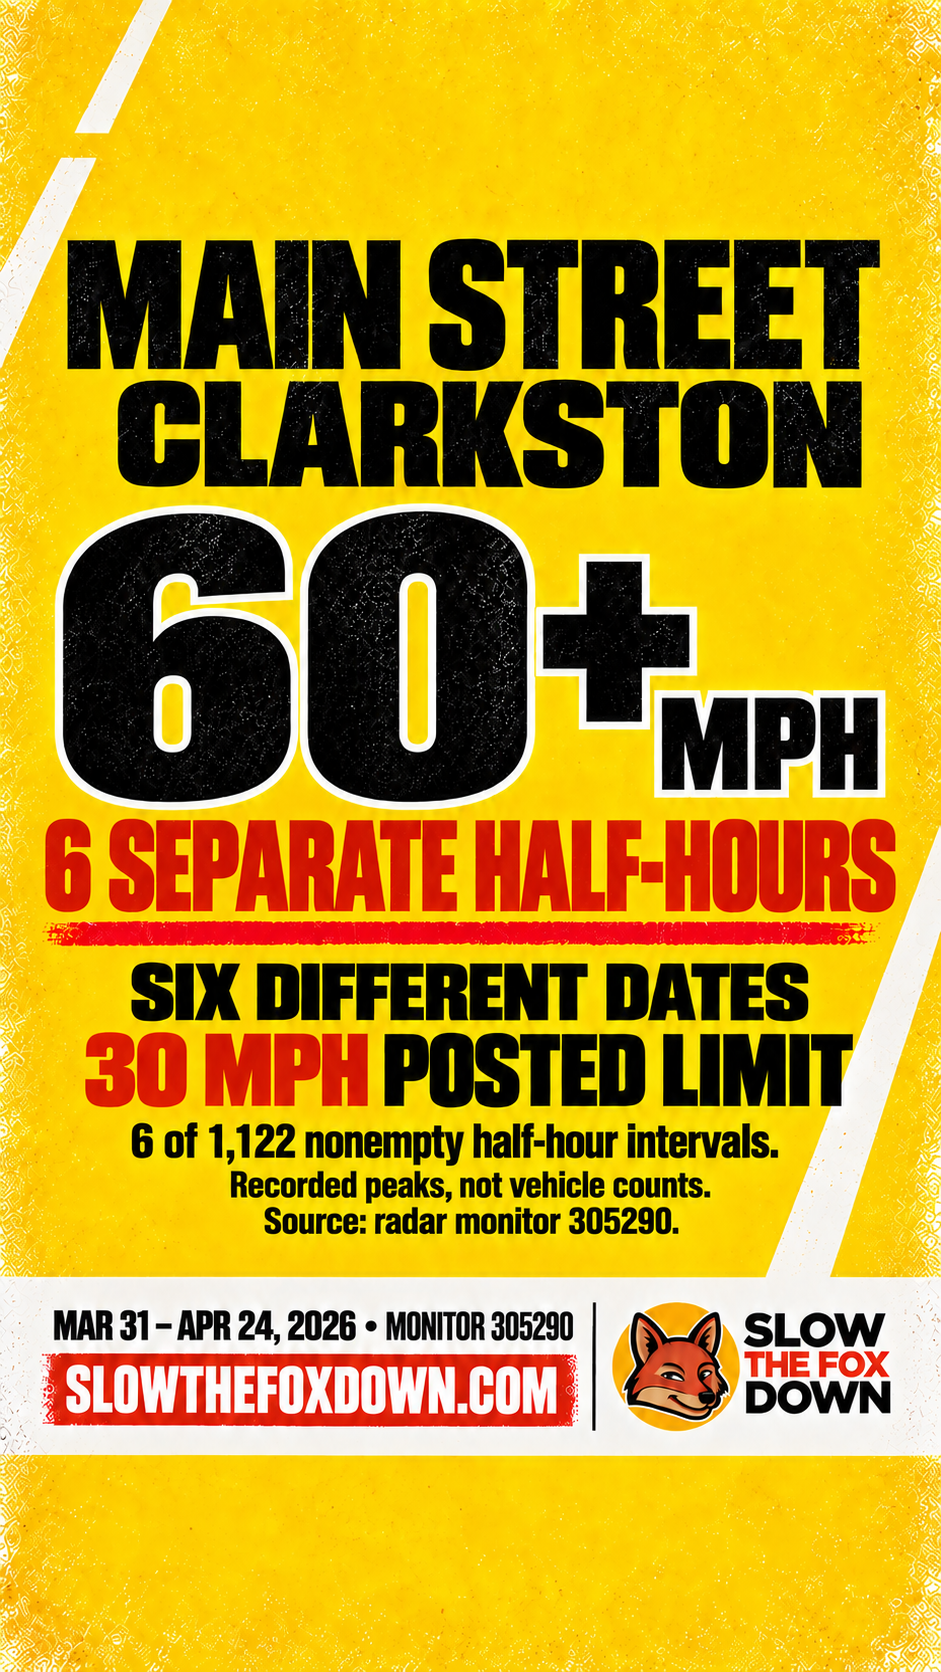
60+ mph in six separate half-hours. Six intervals, not six vehicles. Recorded peaks; source: radar monitor 305290. March 31–April 24, 2026. SlowTheFoxDown.com.

High peaks on six different dates

60+ mph in six separate half-hours.

Download square PNG Download vertical Story
Caption to copy
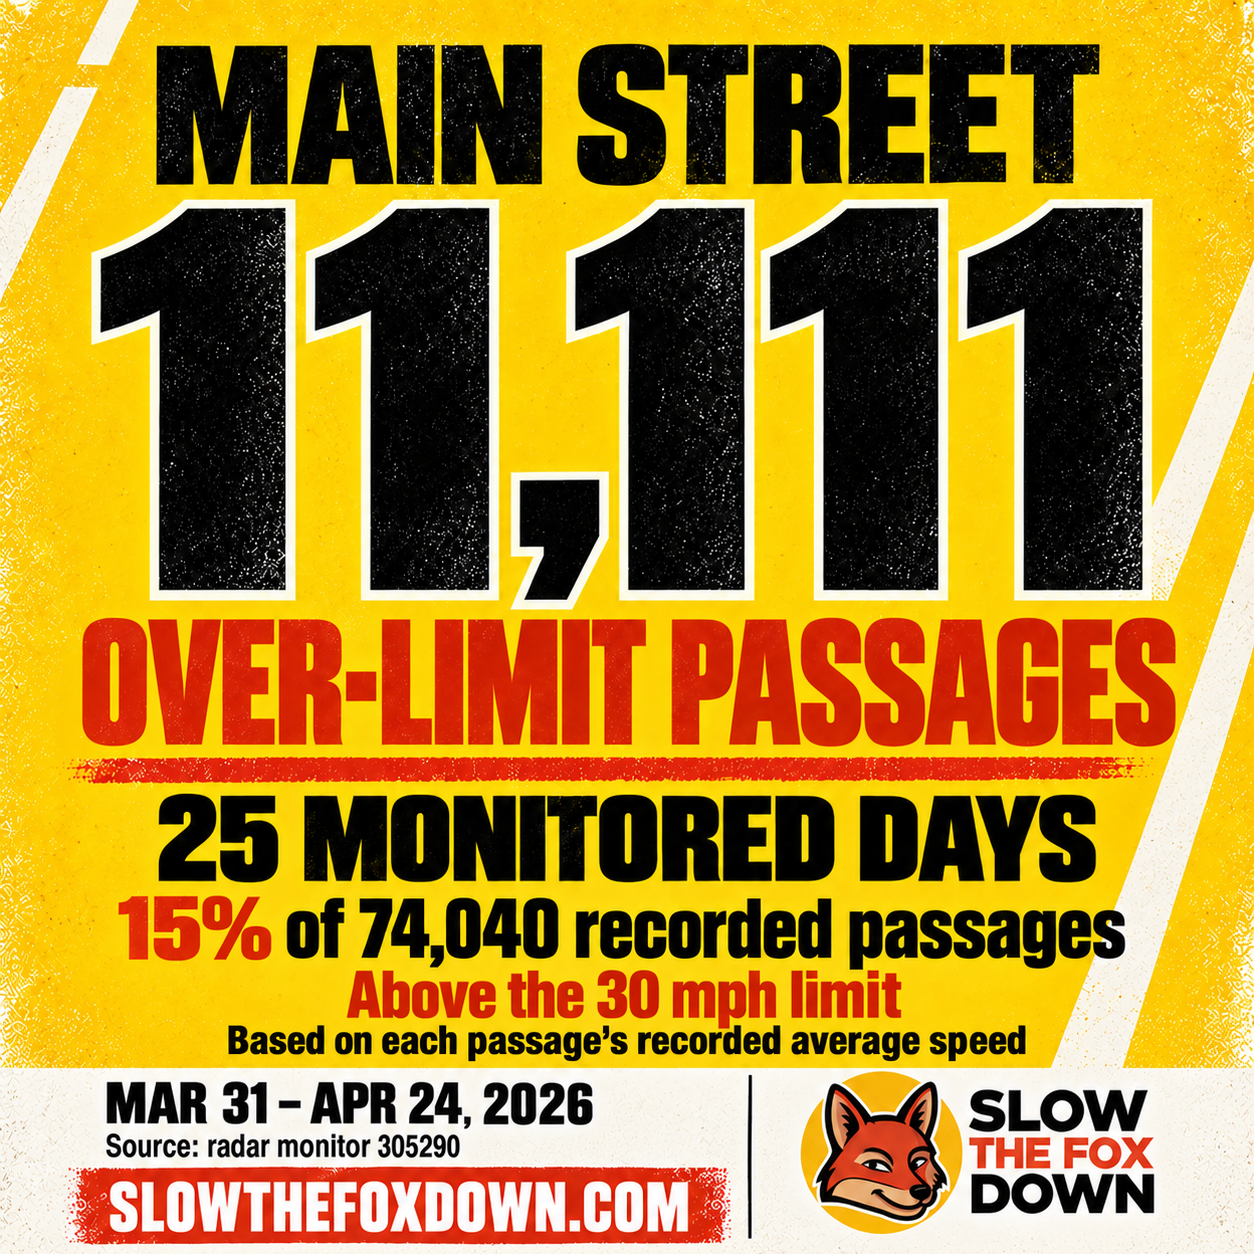
11,111 passages averaged above 30 mph across 25 monitored dates. 15% of 74,040 passages. Based on each passage’s recorded average speed. March 31–April 24, 2026. SlowTheFoxDown.com.

Across 25 monitored dates

11,111 above-limit passage averages.

Download square PNG
Caption to copy
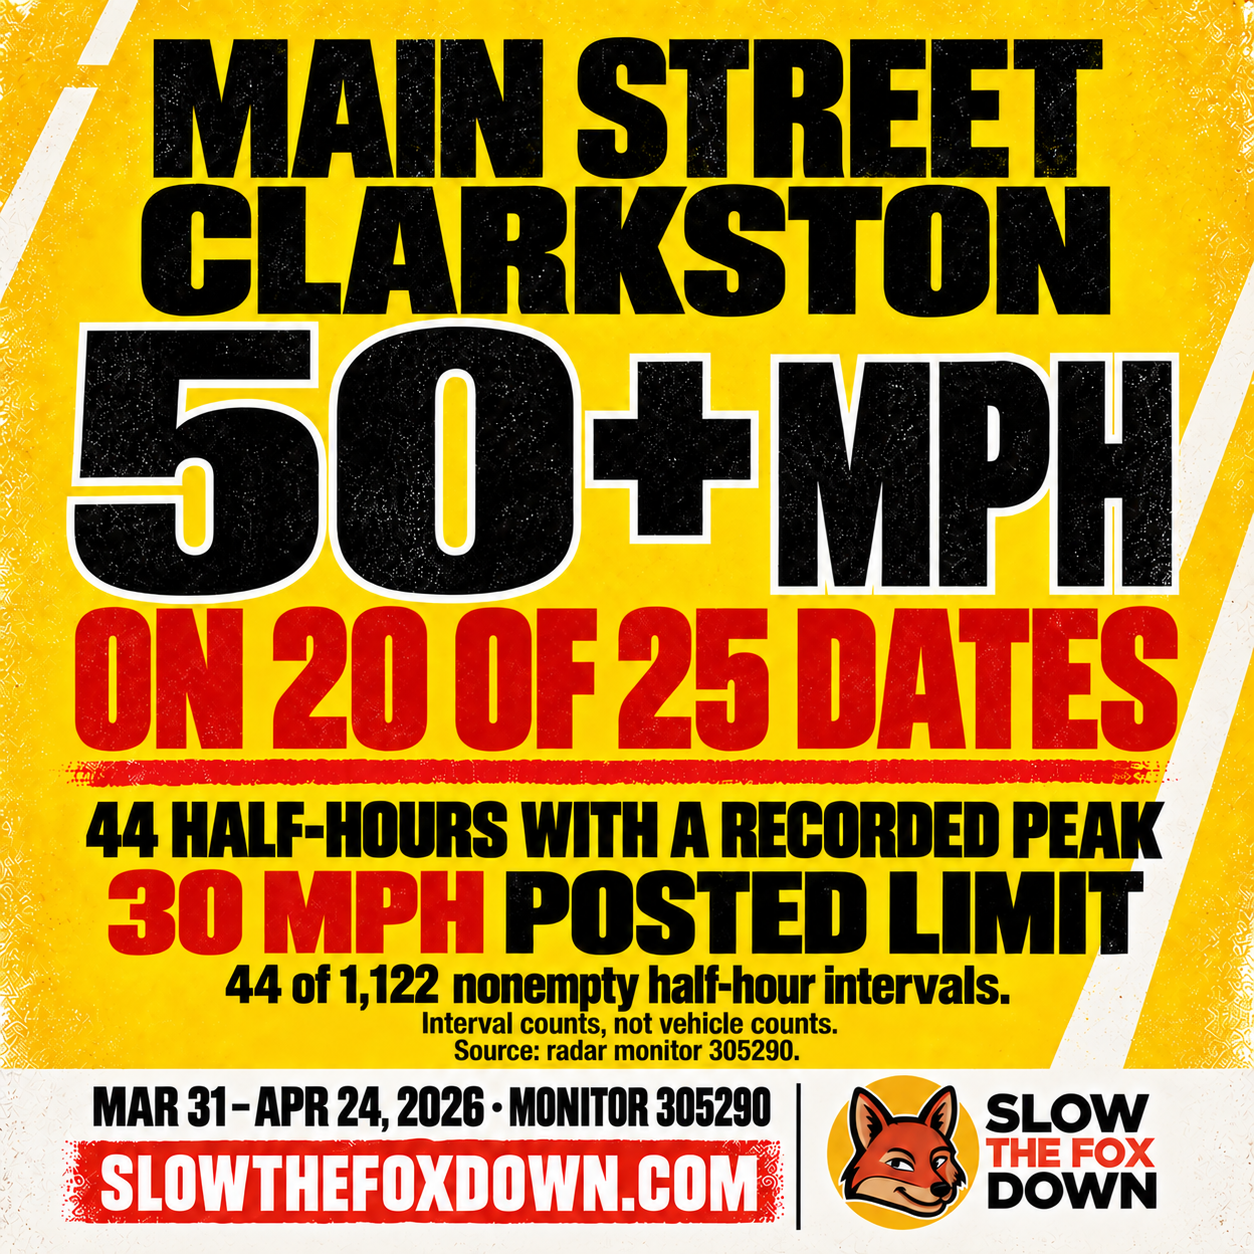
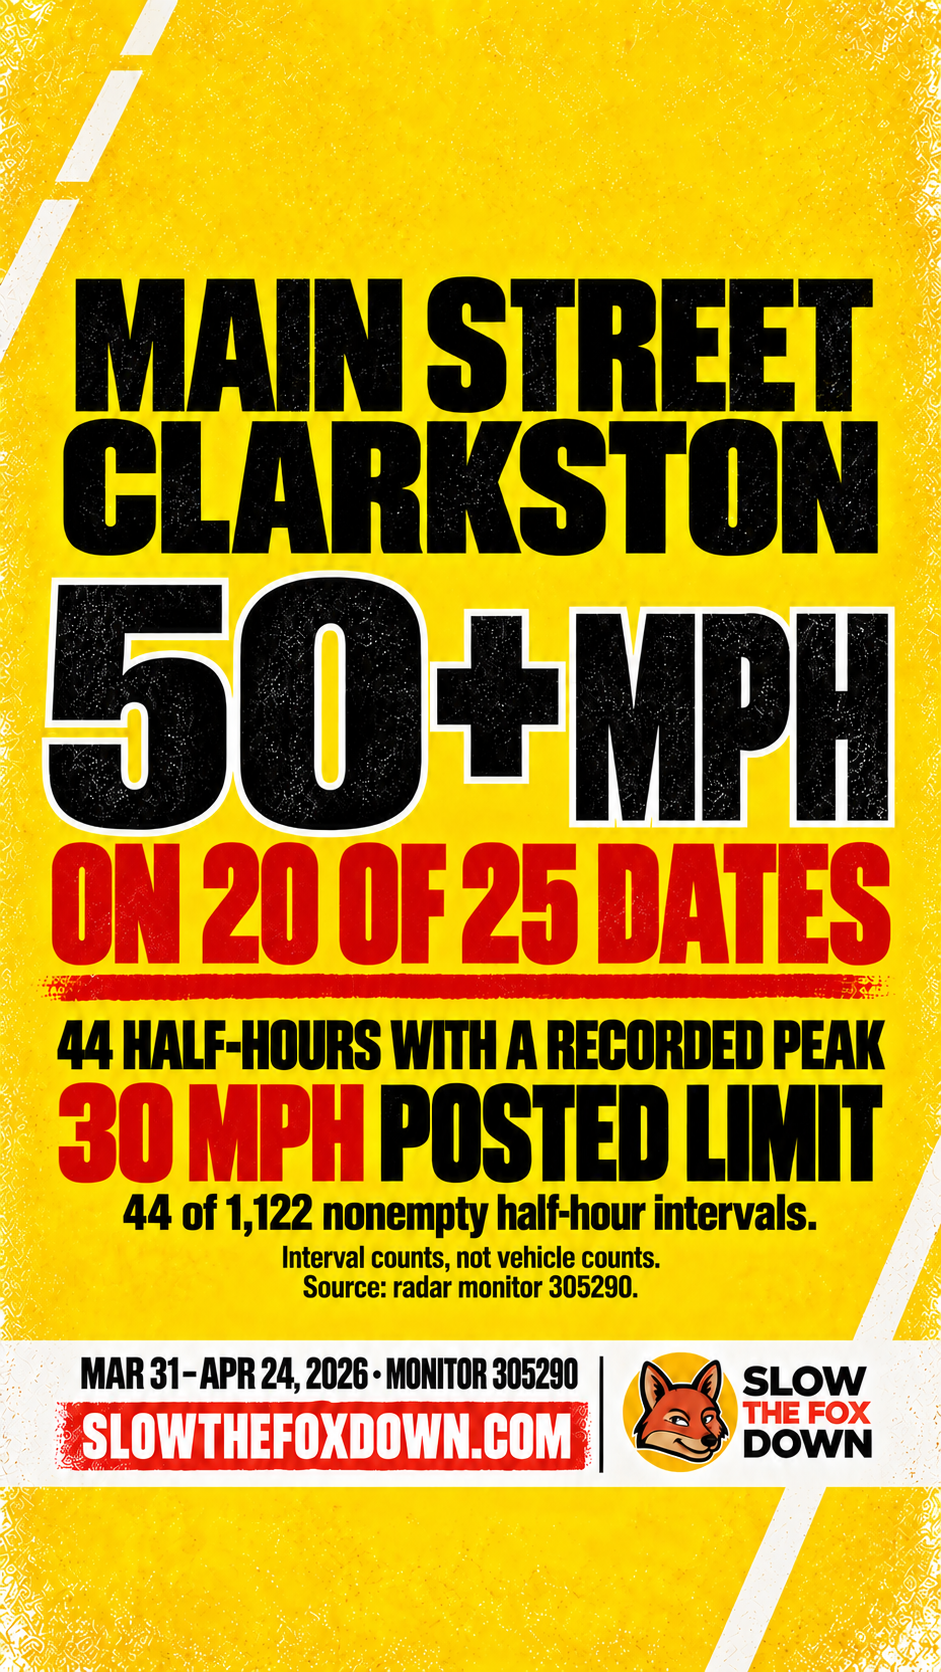
50+ mph peaks across 20 dates. 44 of 1,122 nonempty half-hours; not a vehicle count. Source: radar monitor 305290. March 31–April 24, 2026. SlowTheFoxDown.com.

44 separate half-hours

50+ mph peaks across 20 dates.

Download square PNG Download vertical Story
Caption to copy
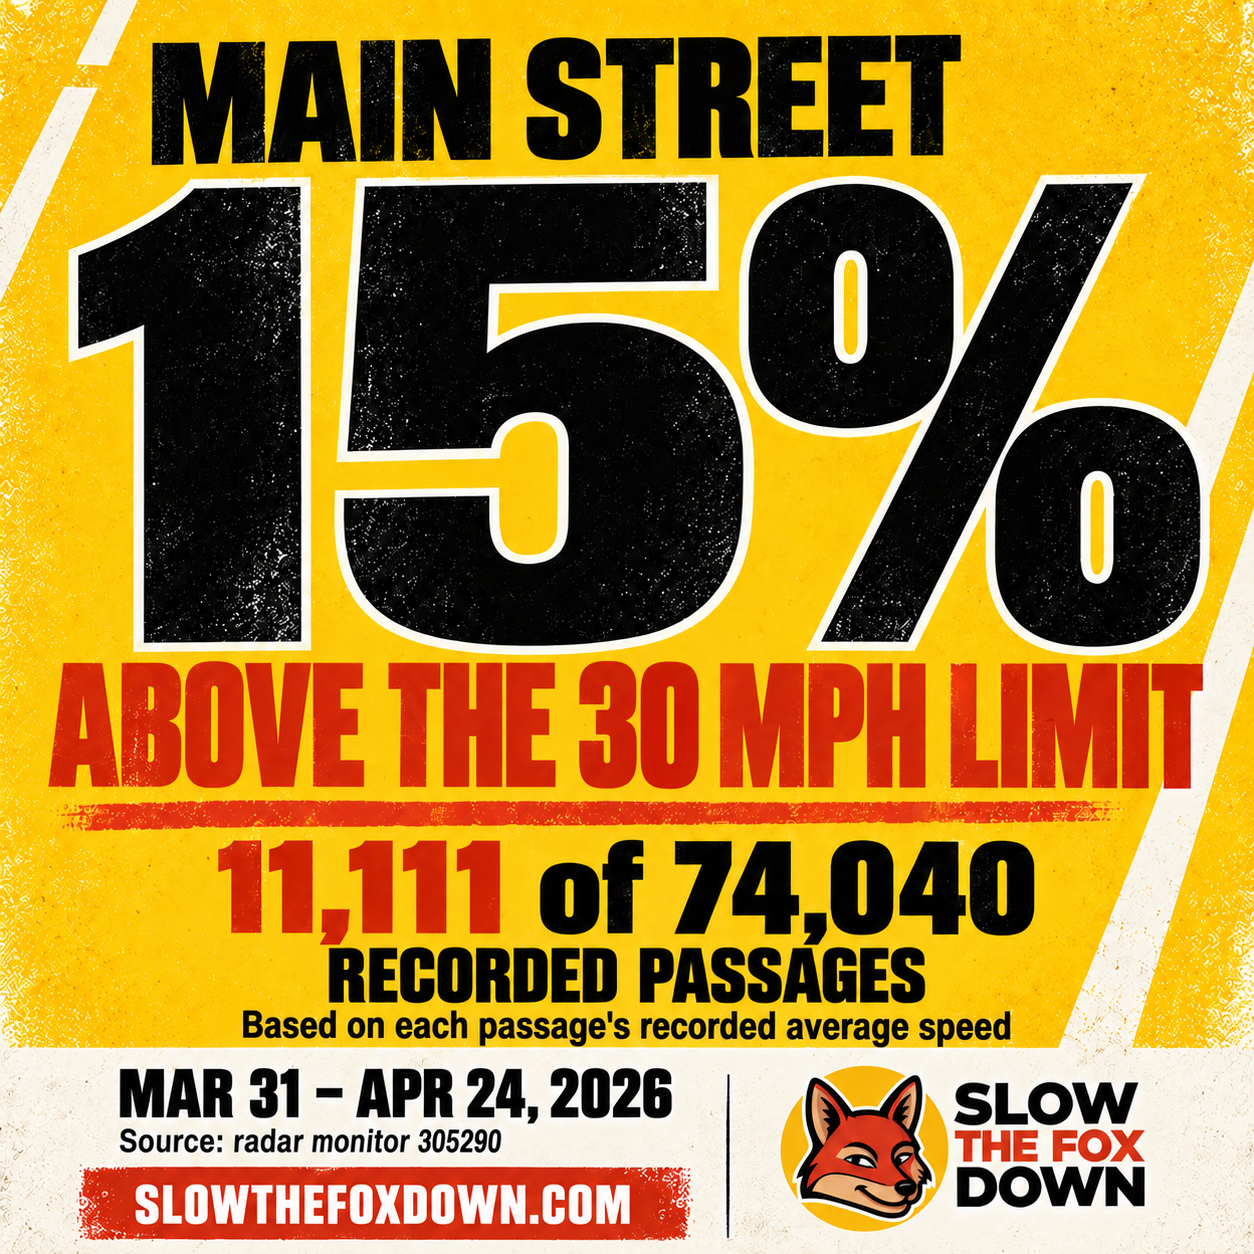
Main Street in Clarkston: 15% above the 30 mph limit. 11,111 of 74,040 recorded passages, March 31–April 24, 2026. Based on each passage’s recorded average speed. March 31–April 24, 2026. SlowTheFoxDown.com.

How much speeding?

15% above the posted limit.

Download square PNG
Caption to copy

The data behind every post

Explore the
detailed report.

Daily counts, hourly patterns, a speed heatmap and the complete methodology. Every report card includes a visible link to SlowTheFoxDown.com.

What these numbers mean

Peak cards show recorded interval maxima. Counts of 50+ or 60+ mph windows are half-hours, not counts of vehicles. The categories overlap. Source: radar monitor 305290’s original export.

Average-speed cards cover 74,040 passages, including repeat trips. First and last days are partial.

Above-limit passage rates use recorded average speeds; high-speed case cards use interval peaks. This report describes observations. It does not establish why speeds differ, measure a before-and-after effect of the sign, or determine overall road safety.

Source: radar monitor 305290 · March 31–April 24, 2026